

In recent months, most central banks were saying and doing the same thing. Policy committees were focused on inflation and hiking rates to slow demand and thereby putting downward pressure on inflation. The U.S central bank increased rates by 525 basis points, the European Central Bank (ECB) increased its target rate by 425 basis points, and the Bank of England (BOE) followed suit by hiking rates 515 basis points. Canada’s and Australia’s central bankers followed the pattern. In contrast, the Bank of Japan (BOJ) is bucking trend and has stayed accommodative.
As investors prepare for the rest of this year and for 2024, markets need to adjust to the likelihood that central bankers will not be as coordinated in this period of transition. Europe has stickier inflation despite weakening economic growth, so we could expect a hawkish pause out of the ECB. Diverging policy has direct investment implications, especially for currency markets. If the Fed hikes and the ECB doesn’t, investors could expect the U.S. dollar to appreciate, making things difficult for U.S.-based multinational companies.
Philly Fed President Highlights the “Soft Data”
Patrick Harker, the president of the Philadelphia Fed, gave one of the more interesting interviews at Jackson Hole. He highlighted the missed opportunity that he had to incorporate the soft data from industry leaders into his inflation forecasts. Back in the early days of the pandemic, Fed officials might not have pronounced a “transitory” nature of inflation if they processed the comments in places like the Beige Book where industry leaders were warning about the persistence of higher prices. Fast forward to today, central bankers have to focus on the “risk management” component to monetary policy.
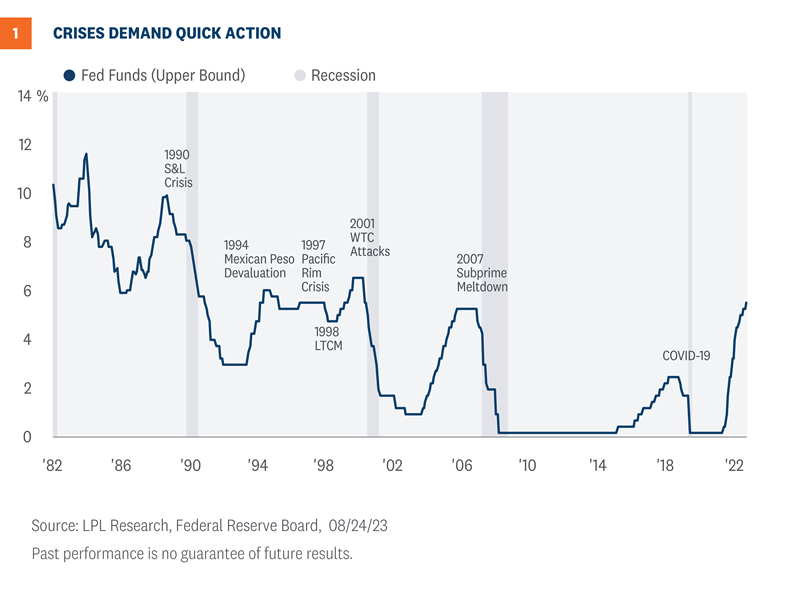
In the history of the central bank, crises present opportunities for policy makers to respond and seek to balance the risk of tightening monetary policy too much against the risk of tightening too little. As shown in Figure 1, the central bank does attempt to manage the risk in a timely way, but a recession often emerges when the Fed hikes aggressively. The uncertainty of this post-pandemic economy and the distortions created by global shutdowns call for vigilance and wisdom. Markets will likely have more choppiness ahead because of these complications.
A New Neutral?
The Jackson Hole symposium is not only a place for central bankers to talk monetary policy, it’s also a place for academics and economists to present updated thinking on the more theoretical concepts within economics. As such, and while most of the buzz heading into the weekend was centered around what Fed Chair Jerome Powell may or may not say in his opening remarks about upcoming policy decisions, there was also a fair amount of chatter regarding (and this is where this Weekly Market Commentary gets a little wonky) the theoretical construct around the neutral interest rate and the potential return of term premia.
The neutral rate is defined as the real interest rate consistent with full employment and the Fed’s 2% inflation target. There is a short-run version of the concept, which is useful for gauging how restrictive policy is currently—or how high the fed funds rate need to be—as well as a longer-term version. The latter is more relevant for answering the question of how long rates need to stay high. Bottom line, the neutral rate is a theoretical rate used to determine how accommodative or restrictive the Fed is with its interest rate policy.
For years, economists have said the neutral rate is close to 0.5% or 2.5% after adjusting for inflation. Now, however, there are some central bank officials and economists who estimate the neutral rate to be higher, perhaps as high as 1.5% (or 3.5% adjusted for inflation). If the neutral rate is indeed higher, then that has implications for the economy as well as the bond market. Historically, when the Fed took the fed funds rate into restrictive territory, things broke (as described above). However, despite over 5% of rate hikes to seemingly very restrictive territory, things aren’t breaking, which may confirm the neutral rate is indeed higher than it has been in the recent history.
Return of Term Premia
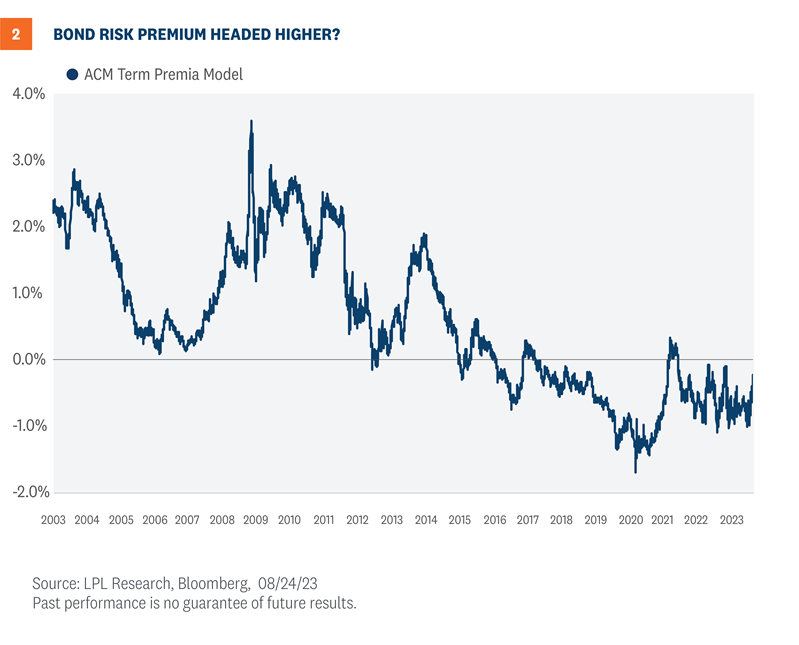
Again turning to the wonky and theoretical stuff (we apologize but it’s important), each security on the Treasury yield curve can be thought of as the expected fed funds rate over the maturity of the security, plus or minus a term premium. The term premium represents the additional compensation investors demand for holding longer maturity Treasury securities. Term premium is generally impacted by monetary policy, as well as growth and inflation expectations (more specifically the volatility of growth and inflation expectations). As seen in Figure 2, after averaging roughly 1% from 2003 until 2015, the bond term premia has been negative recently (meaning fixed income investors have not demanded additional compensation for owning longer maturity Treasury securities). This time period coincided with steadily falling inflation as well as central banks that were actively owning large amounts of Treasury bonds. If those two conditions are fading, as suggested at Jackson Hole, then the bond term premia may indeed be headed higher.
Higher for Longer
After reading all that wonky stuff (thank you), these two theoretical concepts may have real consequences for bond investors. For bond investors, unless something breaks, the fed funds rate is likely going to stay higher than it has over the past decade, which means the 10-year Treasury yield is likely going to stay higher than it has over the last decade. If the new neutral fed funds rate is around 3.5%, then that means the 10-year Treasury is likely going to be around 4.0% (assuming a 0.5% term premia). Now of course, that rate will fluctuate on a daily basis but the 10-year yield could average around 4% over the next decade, which is what it generally averaged in the decade before the Global Financial Crisis (GFC). The good news for bond investors: from the start of 2000 until the GFC, the Bloomberg Aggregate Bond Index generated around 6% average annual returns (no guarantees of course). Paradoxically perhaps, the longer Treasury yields stay higher, the more enduring fixed income is as an asset class. Starting yields are the best predictor of future returns (over longer time horizons), so if Treasury yields remain elevated that of course means yields for other bond asset classes will be higher as well, which means fixed income returns will likely be higher too.
Investment Conclusion
Fed Chair Powell warned that persistent above-trend growth and tighter labor conditions could warrant further tightening. But where the economy is today, investors can still expect no change in rates at the September meeting, but the Committee will be highly data-dependent at the November meeting. Investors need to carefully watch increasing delinquencies and shrinking excess savings for leading indicators of the economy.
In terms of investment implications, we may see the 10-year Treasury yield above what we deem as fair value in the near term despite cooling inflation, before eventually settling back down in the mid-to-high threes if our forecast is right. A Fed pause is increasingly likely in September, which should help send rates down and prop up core bond returns.
LPL Research continues to like high quality fixed income despite upward pressure on rates recently. We think core bond sectors (U.S. Treasuries, agency mortgage-backed securities (MBS), and short-maturity investment grade corporates) are currently more attractive than plus sectors (high-yield bonds and non-U.S. sectors) with the exception of preferred securities, which look attractive after having sold off due to stresses in the banking system. On the equity side, even after the latest dip, LPL Research still believes stocks are a bit above what is justified by fundamentals in the short term.
Important Information
This material is for general information only and is not intended to provide specific advice or recommendations for any individual. There is no assurance that the views or strategies discussed are suitable for all investors or will yield positive outcomes. Investing involves risks including possible loss of principal. Any economic forecasts set forth may not develop as predicted and are subject to change.
References to markets, asset classes, and sectors are generally regarding the corresponding market index. Indexes are unmanaged statistical composites and cannot be invested into directly. Index performance is not indicative of the performance of any investment and do not reflect fees, expenses, or sales charges. All performance referenced is historical and is no guarantee of future results.
Any company names noted herein are for educational purposes only and not an indication of trading intent or a solicitation of their products or services. LPL Financial doesn’t provide research on individual equities.
All information is believed to be from reliable sources; however, LPL Financial makes no representation as to its completeness or accuracy.
US Treasuries may be considered “safe haven” investments but do carry some degree of risk including interest rate, credit, and market risk. Bonds are subject to market and interest rate risk if sold prior to maturity. Bond values will decline as interest rates rise and bonds are subject to availability and change in price.
The Standard & Poor’s 500 Index (S&P500) is a capitalization-weighted index of 500 stocks designed to measure performance of the broad domestic economy through changes in the aggregate market value of 500 stocks representing all major industries.
The PE ratio (price-to-earnings ratio) is a measure of the price paid for a share relative to the annual net income or profit earned by the firm per share. It is a financial ratio used for valuation: a higher PE ratio means that investors are paying more for each unit of net income, so the stock is more expensive compared to one with lower PE ratio.
Earnings per share (EPS) is the portion of a company’s profit allocated to each outstanding share of common stock. EPS serves as an indicator of a company’s profitability. Earnings per share is generally considered to be the single most important variable in determining a share’s price. It is also a major component used to calculate the price-to-earnings valuation ratio.
All index data from FactSet.
Securities offered through LPL Financial, member FINRA/SIPC. Investment advisory services offered through Global Retirement Partners, LLC (GRP), a registered investment advisor. Insurance services offered through HUB International. GRP, Washington Financial Group and HUB International are separate and unaffiliated with LPL Financial. Washington Financial Group is the approved name under which LPL Financial business is conducted.