

Fixed income investors have had a rough time over the last few years. Normally a staid asset class, core bonds (as proxied by the Bloomberg Aggregate Bond Index) have seen negative returns over the last two calendar years and could potentially see negative returns for a third straight year—something that has never happened in the history of the core bond index (since 1975). But, despite the rapid rise in interest rates (fall in bond prices), there’s no reason to believe that we are in the beginning of a sustained bear market. Just because yields fell for many years doesn’t mean that they have to keep rising. In fact, at current levels, after years of artificially suppressed levels, long-term yields are back within longer-term ranges. And with inflation trending in the right direction and the Federal Reserve (Fed) near (at?) the end of its rate hiking campaign, we think the big move in long-term rates has already happened and interest rates are finally back to normal.
The Bond Bull Market is Over. Now What?
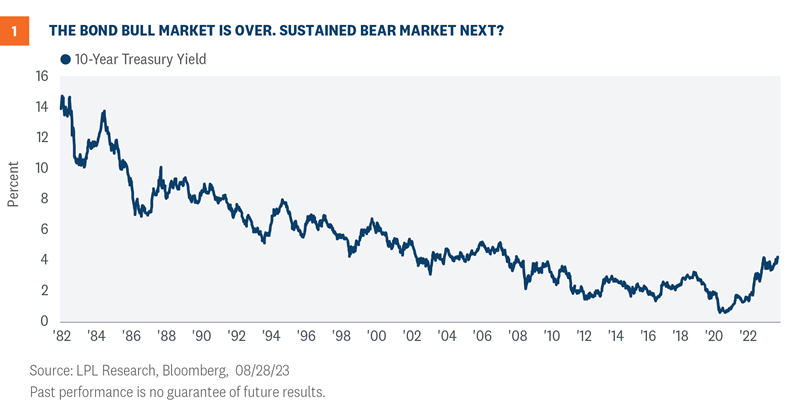
The 1980s were a time of great movies, parachute pants, and even better music. Throw in the release of Pac-Man and the launch of MTV (when they actually played music videos), and the 80s were largely considered by some (me) to be the best decade ever! The 1980s also saw the start of one of the most impressive bull market runs in recent history: The start of the bond bull market.
In an effort to arrest stubbornly high inflationary pressures, and after arguably several policy mistakes, the Fed raised short-term interest rates to 20% in the summer of 1981. The rise in short-term interest rates pressured long-term interest rates higher as well, which peaked above 15% (Figure 1). The rise in short-term interest rates ultimately ended the generationally high inflationary pressures, and interest rates have more or less fallen ever since… until 2020. With inflation rearing its ugly head again, the Fed embarked on another aggressive rate hiking campaign and has taken short-term interest rates to 5.5% (upper bound), definitively ending the bond bull market. But just because interest rates have stopped going down doesn’t mean that they have to keep going up.
Back to Normal
Zooming out and looking at interest rates over a longer time horizon, provides perhaps a bit more clarity on what could be considered normal for interest rates (Figure 2). Data since 1880 shows that interest rates were in a fairly tight range before the spike in interest rates that took the 10-year Treasury yield to those very lofty levels in the 80s. In fact, long-term rates mostly traded within a 3% to 5% range for nearly a century before moving aggressively higher as the Fed fought those generationally high inflationary pressures. Each security on the Treasury yield curve can be thought of as the expected fed funds rate over the maturity of the security, plus or minus a term premium. So, periods outside of that 3% to 5% range have been due to the economy’s growth and inflation dynamics, which ultimately shapes the Fed’s interest rate policy.
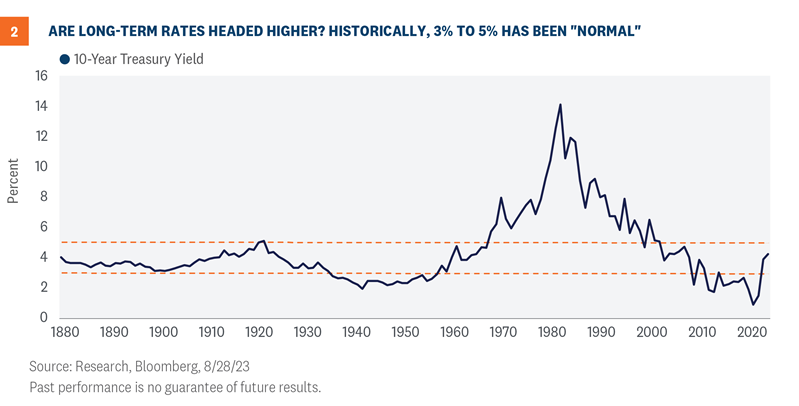
As for the recent deviation from normal, in the aftermath of the Global Financial Crisis, the U.S. experienced a decade of sluggish growth and subdued inflation. Moreover, central banks, globally, engaged in aggressive bond buying schemes to provide liquidity and stability to markets. Throw in a once in a century global pandemic, and interest rates have been kept at very low levels—one could argue artificially suppressed levels. The Fed and other central banks ripped the proverbial Band-Aid off over the last few years, and interest rates are now back into more normal levels.
Could interest rates go higher? It’s possible. With the Treasury Department expected to issue a lot of Treasury securities to fund budget deficits and with the potential for the Bank of Japan (BOJ) to finally end its aggressively loose monetary policies, we could continue to see upward pressure on yields. However, while supply/demand dynamics can influence prices in the near term, the long-term direction of yields is based on expected Fed policy. So unless the Fed isn’t done raising rates due to a resurgence of inflationary pressures (we don’t think that is likely), the big move in yields has likely already taken place. Inflation is trending in the right direction and the Fed could be near (at?) the end of its rate hiking campaign. That doesn’t mean rates are going to fall dramatically from current levels though, and that is fine for the longer-term prospects for fixed income investors.
Why You May Need to Think About Bonds Differently
Fixed income instruments are fundamentally different than a lot of other financial instruments. Bonds are not only financial instruments, but they are also financial obligations that are contractually obligated to pay periodic coupons and return principal at or near par at the maturity of the bond. That is, absent defaults, there is a certainty with bonds that you just don’t get from many other financial instruments. And because starting yields take into consideration the underlying price of the bond as well as the characteristics listed above, starting yields are the best predictor of future returns. Starting yields and subsequent returns for the Bloomberg Aggregate index have a very tight relationship. For holding periods as short as five years or as long as 10 years, starting yields explain approximately 95% of the variation in returns for the index.
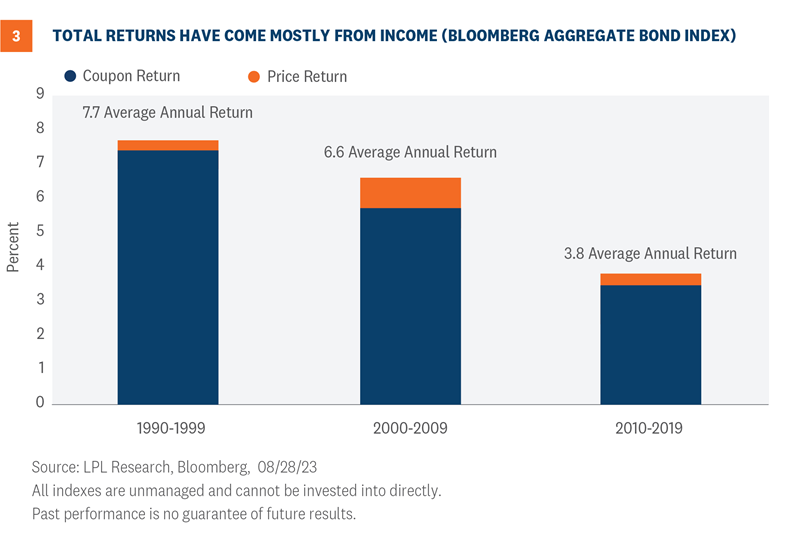
Moreover, as seen in Figure 3, coupon income is more important than changes in prices from falling interest rates. In fact, while falling (or rising) interest rates dominate total returns in the short-term, coupon income is the primary contributor for fixed income returns over longer horizons. So while other financial instruments (equities) tend to provide more price appreciation relative to income, it’s the opposite for bonds. The income component is much more important than price changes over time.
As we mentioned in last week’s Weekly Market Commentary, the fed funds rate is likely going to stay higher than it has over the past decade, which means the 10-year Treasury yield is likely going to stay higher than it has over the last decade. If the new neutral fed funds rate is around 3.5%, then that means the 10-year Treasury is likely going to be around 4.0%, plus or minus. Now of course, that rate will fluctuate on a daily basis but the 10-year yield could average around 4% over the next decade, which is what it generally averaged in the decade before the Global Financial Crisis (GFC).
The good news for bond investors: from the start of 2000 until the GFC, the Bloomberg Aggregate Bond Index generated around 6% average annual returns. Paradoxically perhaps, the longer Treasury yields stay higher, the more enduring fixed income is as an asset class. Starting yields are the best predictor of future returns (over longer time horizons), so if Treasury yields remain elevated, that means yields for other bond asset classes will be higher as well, which means fixed income returns could likely be higher too.
Conclusion
There are three primary reasons to own fixed income: diversification, liquidity, and income. And with the increase in yields recently, fixed income is providing income again. Right now, investors can build a high-quality fixed income portfolio of U.S. Treasury securities, AAA-rated Agency mortgage-backed securities (MBS), and short maturity investment grade corporates that can yield 6-6.5%. Investors don’t have to “reach for yield” anymore by taking on a lot of risk to meet their income needs.
Important Information
This material is for general information only and is not intended to provide specific advice or recommendations for any individual. There is no assurance that the views or strategies discussed are suitable for all investors or will yield positive outcomes. Investing involves risks including possible loss of principal. Any economic forecasts set forth may not develop as predicted and are subject to change.
References to markets, asset classes, and sectors are generally regarding the corresponding market index. Indexes are unmanaged statistical composites and cannot be invested into directly. Index performance is not indicative of the performance of any investment and do not reflect fees, expenses, or sales charges. All performance referenced is historical and is no guarantee of future results.
Any company names noted herein are for educational purposes only and not an indication of trading intent or a solicitation of their products or services. LPL Financial doesn’t provide research on individual equities.
All information is believed to be from reliable sources; however, LPL Financial makes no representation as to its completeness or accuracy.
US Treasuries may be considered “safe haven” investments but do carry some degree of risk including interest rate, credit, and market risk. Bonds are subject to market and interest rate risk if sold prior to maturity. Bond values will decline as interest rates rise and bonds are subject to availability and change in price.
The Standard & Poor’s 500 Index (S&P500) is a capitalization-weighted index of 500 stocks designed to measure performance of the broad domestic economy through changes in the aggregate market value of 500 stocks representing all major industries.
The PE ratio (price-to-earnings ratio) is a measure of the price paid for a share relative to the annual net income or profit earned by the firm per share. It is a financial ratio used for valuation: a higher PE ratio means that investors are paying more for each unit of net income, so the stock is more expensive compared to one with lower PE ratio.
Earnings per share (EPS) is the portion of a company’s profit allocated to each outstanding share of common stock. EPS serves as an indicator of a company’s profitability. Earnings per share is generally considered to be the single most important variable in determining a share’s price. It is also a major component used to calculate the price-to-earnings valuation ratio.
All index data from FactSet.
Securities offered through LPL Financial, member FINRA/SIPC. Investment advisory services offered through Global Retirement Partners, LLC (GRP), a registered investment advisor. Insurance services offered through HUB International. GRP, Washington Financial Group and HUB International are separate and unaffiliated with LPL Financial. Washington Financial Group is the approved name under which LPL Financial business is conducted.